Wednesday 12 March 2014

Aadhar Count

Aadhaar is a 12 digit individual identification number issued by the Unique Identification Authority of India on behalf of the Government of India. Aadhaar is: a)Easily verifiable in an online, cost-effective way b)Unique and robust enough to eliminate the large number of duplicate and fake identities in government and private databases c)A random number generated, devoid of any classification based on caste, creed, religion and geography. 
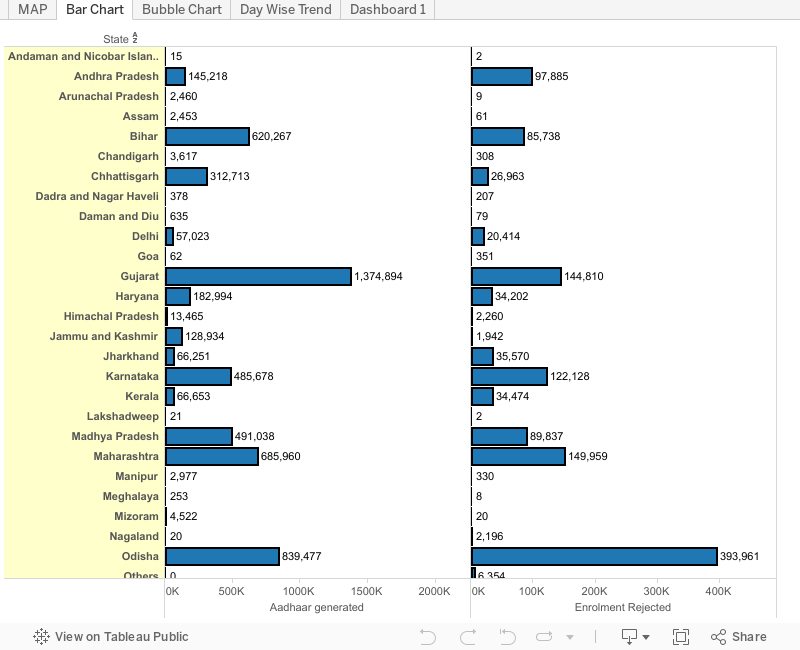
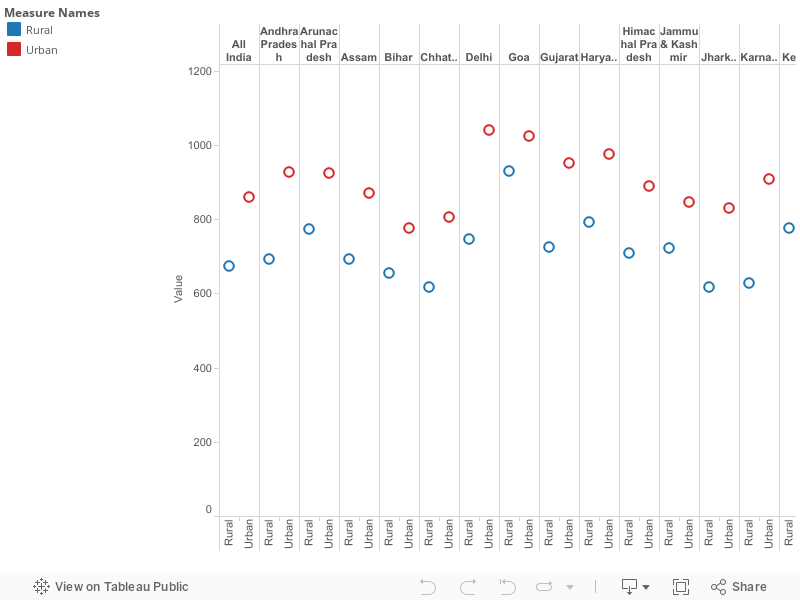
3 charts portray analysis of Aadhar generated and Enrollment Rejected across states of India during the period of 1st March to 8th March 2014. MAP - It visualize States location on the India map & Aadhar Data. Bar Chart - It reflects comparative analysis of State-wise Aadhar genertion & Enrollment Rejection figures. Bubble Chart - The circles size reflects Aadhar generation count & change in colour shows Enrollment Rejection from Red being Lowest to Blue being Highest. Trend Chart- this graph shows day wise Aadhar Status.

Sunday 9 February 2014

The Dashboard on this blog

Data Source

Monday 27 January 2014


Thursday 23 January 2014

Sheet 2 Chart - Sheet, Range, Cols

<head>
<script type="text/javascript" src="https://www.google.com/jsapi"></script>
<script type="text/javascript">
google.load("visualization", '1', {packages:['corechart']});

google.setOnLoadCallback(drawChart01);


function drawChart01() {


 var query = new google.visualization.Query(
      'https://docs.google.com/spreadsheet/ccc?key=0Autj6tQDIzyCdFRXYjdZMm1BMWFCd0hoZ3R2NTh2RWc#gid=0=Demo1&range=B3:C15&headers=1');
      query.setQuery('select B,C'); 
  query.send(handleQueryResponse01);
}

function handleQueryResponse01(response) {
  if (response.isError()) {
    alert('Error in query: ' + response.getMessage() + ' ' + response.getDetailedMessage());
    return;
  }
  
  var options = {
          title: 'No of Beds Vs. Full Time Employees in Hospitals',
          vAxis: {title: 'No of Beds',  titleTextStyle: {color: 'red'}},
          width: 600,
          height : 800
        };


  var data = response.getDataTable();
  var chart = new google.visualization.BarChart(document.getElementById('ChartSpan4'));
  chart.draw(data, options );
}


</script>

<title>Sheet 2 Chart - Sheet, Range, Cols</title>
</head>

<body>

<span id='ChartSpan4'></span>
</body>

Wednesday 15 January 2014

and here i can put some text